Overview
Intensive Care Unit (ICU) readmissions cause serious problems for hospitals, patients, and insurers. For patients, readmissions not only lead to longer hospital stays, but also a clinically-studied increase in mortality. For insurers and hospitals, readmissions lead to higher healthcare costs and significant reimbursement penalties. While recent research has outlined novel AI/ML recommendation systems, many avenues remain unexplored as the availability of big data in the healthcare field continues to expand. Our capstone group seeks to use various machine learning techniques to create a model that can accurately predict which ICU patients are at risk of having negative outcomes (including readmission and death). This model seeks to differentiate from existing research in the field by:
a) Emphasizing model interpretation in order to help providers understand why a patient was flagged for risk of readmission or death
b) Seeking to understand the transferability of different approaches using cross validation from two of the most prominent datasets available today
Problem
One in ten patients who are discharged from an ICU will be readmitted in 60 days or less. These patients, once readmitted, display a 6x higher hospital mortality rate and cost over $15,200 per readmission. Under the Affordable Care Act (ACA), healthcare systems can be penalized up to 3% of stay income by Medicare and Medicaid for readmissions. These penalties are most often levied the most on under-resourced, rural hospital systems.
Most healthcare providers today rely upon clinician intuition, a variety of hospital policies, and general availability to guide ICU discharge decisions, A machine learning-based approach could help augment today’s intuition-based or one-size-fits-all approaches by flagging not only patients at risk for readmission, but showing with lab, chart, or demographic features led to the initial warning.
Datasets
We are using two distinct datasets, MIMIC-IV and eICU, which are both semi-publically available through Physionet upon completion of a course on human studies research and approval of application for use. MIMIC-IV contains data from the critical care unit at Beth Israel Deaconess Hospital in Boston from 2008-2019 with approximately 380,000 patients and 520,000 stays overall. It includes information such as demographics, lab measurements, medications and vital signs. The second dataset is the eICU dataset, which provides data from critical care units at 200 hospitals around the continental U.S from 2014-2015 for approximately 140,000 patients and 200,000 stays. It includes the same kind of information such as demographics, lab measurements, medications and vital signs.
Features
Both the eICU dataset and the MIMIC-IV dataset contain a huge wealth of information about patients and the care they receive at the hospitals, including thousands of different potential lab value measurements during ICU stays. We focused on a combination of basic demographic data and lab values from the patient charts during the ICU stay itself. Many patients have repeated measurements of a given lab during their stay; in order to aggregate across these measurements without losing too much information, we included both the last measurement taken before the end of the ICU stay as well as the rate of change in the value (calculated as the delta in the value itself divided by the time between first and last measurements while in the ICU).
We considered multiple approaches to selecting variables for inclusion in our models. In one approach, we relied on literature review and previous work that consulted creditable clinician to determine features that were likely to be recorded for most patients and useful for predicting health outcomes. The variables used in these models include the following:
- Demographics: age, gender, ethnicity, marital status, insurance type
- Stay characteristics: length of stay, has prior stay, care unit
- Clinical measurements: Last value: heart rate, respiratory rate, O2 saturation, GCS (eye, motor verbal), temperature, sodium, potassium, creatinine, hematocrit, glucose, hemoglobin, platelet count, admission weight
We also attempted modeling on a dataset that included every variable, including both the last value and rate of stay for each lab and chart value. This created a dataframe of 1,433 features. While the team was able to have a broader understanding of feature importance from these all-inclusive models, model AUC performance suffered due to general overfitting and noise. We also wanted to maintain explainability in our model and therefore avoided dimensionality reduction techniques such as PCA and CA in future models.
Outcomes
60-Day Readmission or In-Hospital Death
The first outcome variable we examined was 60-day readmission or in-hospital death. This was a fairly broad outcome designed to capture as many outcomes as possible while still constraining the time period to increase the likelihood of an association between the original ICU stay and the readmission. This variable was calculated by taking relative times between different ICU stays for the same patient, which was possible in the MIMIC dataset due to their system of providing consistent timing information for one patient across multiple hospital admissions. We chose to include death as well as readmission in this outcome because death is an important negative outcome that competes with the risk of readmission; i.e. if someone dies in the hospital then they can’t be readmitted. The limited reporting of death in this dataset means we can only include in-hospital death.
48-Hour Readmission or In-Hospital Death (with observability requirement)
We also implemented a 48-hour readmission/death outcome as a target variable for all our models and all our datasets. The eICU dataset only provided relative timing information within single hospital admissions, meaning that the only type of readmission that could be examined was when an ICU patient was discharged to the floor of the hospital and then later readmitted to the ICU. Because most of these types of readmissions happen within a short time window, we elected to use a much shorter time window for predictions. In order to be consistent about defining readmissions, we removed any observations from patients who left the hospital within 48 hours or prior to having an outcome, because they could have been fully discharged and then readmitted to the ICU within the 48 hour time frame but we would not have been able to accurately classify the outcome due to the limitations on timing data reporting in eICU. We implemented an analogous restriction in the MIMIC dataset in order to be consistent across models, allowing for comparison and our later cross-training step.
Modeling
Once we had identified the variables of interest, we prepared the data for our machine learning models by filling in missing values in categorical variables with ‘unknown’ and using simple imputation with the median to fill in missing values of numeric variables, utilizing the SKLearn package for Python.
We experimented with a variety of different machine learning algorithms, including logistic regression, decision trees, random forests, gradient boost, XGBoost, CatBoost, and TabNet. After hyperparameter tuning, we selected XGBoost as our consistently highest-performing model.
Results
XGBoost was consistently a top-performing approach across all datasets and outcomes that we examined. For the 48-hour outcome, the AUC was in the high 80’s or low 90’s for both datasets, which would help encourage trust in the model’s predictions if deployed in an ICU to help decide which patients are highest priority for additional examination and care prior to discharge.
There was a notable performance difference between the 60-day outcome and the 48-hour outcome used for the MIMIC dataset, with all models performing much better using the 48-hour outcome. This is likely due to a combination of factors, including more immediate correspondence between clinical measurements and the negative outcome due to the short time window as well as a reduction in misclassification due to requiring observability during the 48-hour window. For example, using the 60-day outcome, there may have been patients who did die within 60 days of discharge from the ICU, but if it did not occur in this hospital, then it is not observable in this dataset and therefore not recorded as an outcome. This may be driving down the results of the model if it is accurately picking up on similarities between these patients and patients who do have observable outcomes.
Table 1: Results from training and predicting outcomes using the MIMIC-IV dataset on two different outcomes: (1) ICU readmission or in-hospital death within 60 days of ICU discharge, and (2) ICU readmission or in-hospital death within 48 hours of ICU discharge among patients remaining in the hospital (i.e. discharged from the ICU to the floor or other stepdown unit).
| Model | Outcome 1: 60 Days (AUC) | Outcome 2: 48 Hours (AUC) |
|---|---|---|
| Logistic Regression | 67.8 | 84.0 |
| Decision Tree | 66.0 | 83.9 |
| XGBoost | 73.1 | 91.8 |
We ran the same model types on the eICU dataset, but with a modified list of input variables since not all the variables used in MIMIC were available in eICU. The results for the 48 hour outcome were consistently higher than those in the MIMIC dataset.
Table 2: Results from training and predicting outcomes using the eICU dataset on outcome 2: ICU readmission or in-hospital death within 48 hours of ICU discharge among patients remaining in the hospital (i.e. discharged from the ICU to the floor or other stepdown unit).
| Model | Outcome 2: 48 Hours (AUC) |
|---|---|
| Logistic Regression | 87.7 |
| Decision Tree | 87.2 |
| XGBoost | 94.4 |
Lastly, we created models where we trained one one dataset and test on the other dataset in order to examine the generalizability of these models. The feature set was reduced to variables that were common between the two datasets. Table 3 shows the AUC scores from these models for both directions of train/test dataset choice. The cross-dataset approach has a noticeable decline in AUC score; however, the results for XGBoost when trained on MIMIC and tested on eICU are still quite high. This shows that there is the potential for building generalizable models that can be trained on a large dataset from one location and then deployed in other locations as an efficient way to guide clinician decision-making on a broad scale.
Table 3: Results (AUC) from cross-dataset training for outcome 2: ICU readmission or in-hospital death within 48 hours of ICU discharge among patients remaining in the hospital (i.e. discharged from the ICU to the floor or other stepdown unit).
| Model | Train MIMIC, test eICU | Train eICU, test MIMIC |
|---|---|---|
| Logistic Regression | 77.6 | 79.1 |
| Decision Tree | 80.5 | 78.3 |
| XGBoost | 85.0 | 79.9 |
Interpretability
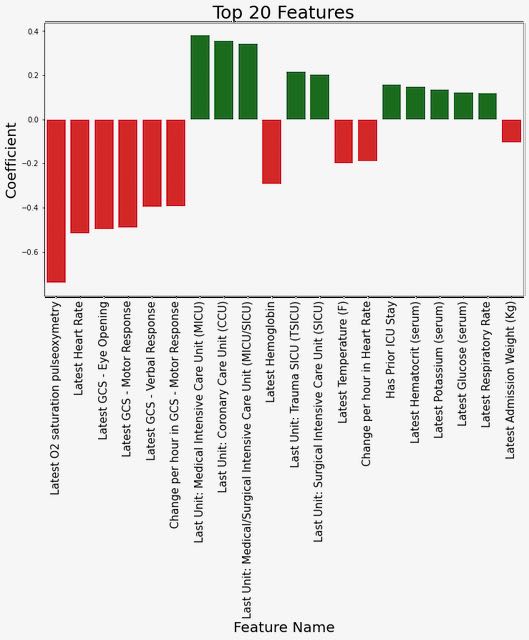
We explored several different approaches to highlighting which features were most influential in predicting an outcome of readmission or death, focusing on the model trained using MIMIC data to predict the 48-hour outcome since this was our primary generalizable model. First, we examined the coefficients for the top features from the logistic regression model (see Figure 1). From this, we can observe that lower values of O2 saturation, heart rate, and the Glasgow Coma Score response variables are associated with an increased risk of outcome.
Figure 1: Coefficient weights from the logistic regression model trained on MIMIC data to predict the 48-hour outcome.
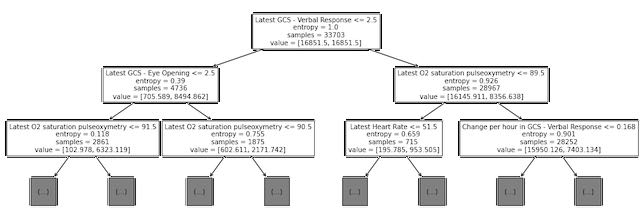
Next, we examined the split points for the first several levels of the trained decision tree model (see Figure 2).. Although this is not directly analogous to examining the coefficients with high magnitude for the logistic regression model, we did note that some of the same variables (O2 saturation, heart rate, and GCS scores) are used for early splits in the decision tree.
Figure 2: Decision tree plot showing top three levels of tree trained on MIMIC data to predict the 48-hour outcome.
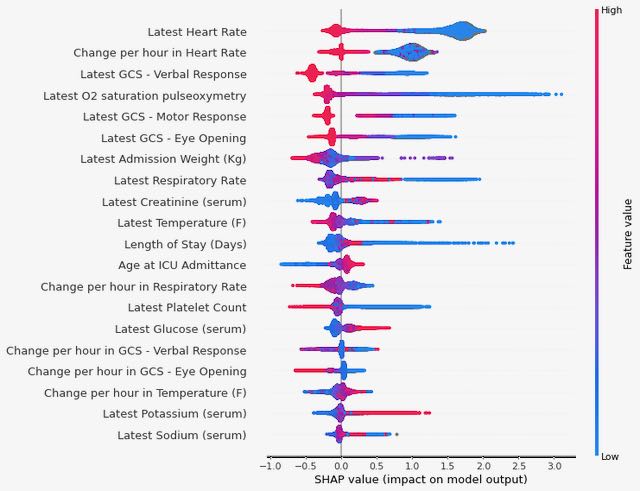
Finally, we used Shapley values to investigate which variables are contributing most to the final predictions from our XGBoost model (see Figure 3). We again see some consistency in the top variables appearing here, with both the last recorded value of heart rate during the ICU stay and the rate of change in heart rate over the course of the stay having high predictive value (low values for either of these are correlated with an increased risk of the outcome).
Figure 3: Summary of Shapley values for the XGBoost model trained on MIMIC data to predict the 48-hour outcome.
Discussion
Based on the differences we observed in the model’s ability to predict our two outcomes, future work may benefit from focusing on relatively short time spans for predicting readmission or death, and also should take into account variations in observability between patients. Also, we were able to identify some key predictors that were consistently impacting predictions across our models, which is informative for feature selection as well as providing guidance to clinicians on prioritizing ICU patients. We do want to note that just because these factors are strong predictors does not mean they are causally related to the outcome and should therefore be treated directly; treatment decisions should be made based on clinical expertise. In addition, our models generalized reasonably well between datasets drawn from different locations, meaning that there is the potential for future work to focus on building a single model or small number of models that can be deployed in multiple locations.
Supporting Slides
Google Slides - Final Presentation
Citations
- Johnson, A., Bulgarelli, L., Pollard, T., Horng, S., Celi, L. A., & Mark, R. (2021). MIMIC-IV (version 1.0). PhysioNet. https://doi.org/10.13026/s6n6-xd98.
- Pollard, T., Johnson, A., Raffa, J., Celi, L. A., Badawi, O., & Mark, R. (2019). eICU Collaborative Research Database (version 2.0). PhysioNet. https://doi.org/10.13026/C2WM1R.
- The eICU Collaborative Research Database, a freely available multi-center database for critical care research. Pollard TJ, Johnson AEW, Raffa JD, Celi LA, Mark RG and Badawi O. Scientific Data (2018). DOI: http://dx.doi.org/10.1038/sdata.2018.178.
- Goldberger, A., Amaral, L., Glass, L., Hausdorff, J., Ivanov, P. C., Mark, R., … & Stanley, H. E. (2000). PhysioBank, PhysioToolkit, and PhysioNet: Components of a new research resource for complex physiologic signals. Circulation [Online]. 101 (23), pp. E215–e220.
- “Welcome to the Shap Documentation.” Welcome to the SHAP Documentation - SHAP Latest Documentation, 2018, https://shap.readthedocs.io/en/latest/index.html.
- “XGBoost Documentation¶.” XGBoost Documentation - Xgboost 1.5.2 Documentation, 2021, https://xgboost.readthedocs.io/en/stable/.
- van Sluisveld, Nelleke et al. “Variation in rates of ICU readmissions and post-ICU in-hospital mortality and their association with ICU discharge practices.” BMC health services research vol. 17,1 281. 17 Apr. 2017, doi:10.1186/s12913-017-2234-z
- Overview of Clinical Conditions With Frequent and Costly Hospital Readmissions by Payer, 2018, Agency for Healthcare Research and Quality, July 2021, https://www.hcup-us.ahrq.gov/reports/statbriefs/sb278-Conditions-Frequent-Readmissions-By-Payer-2018.jsp#:~:text=In%202018%2C%20there%20were%20a,average%20readmission%20cost%20of%20%2415%2C200.
About Us
This website is the final deliverable for our capstone project as part of the course W210: Synthetic Capstone in the UC Berkeley Master of Information and Data Science (MIDS) program. We took the course in the spring of 2022 with Puya Vahabi and Alberto Todeschini. More information about us is below.
Dahler Battle [Linked-in] [Github]

Mohamed Gesalla [Linked-in] [Github]

Natasha Flowers [Linked-in] [Github]